Revenue Optimization for SaaS: A Practical Playbook
A 2026 industry summary reports that annual U.S. subscription revenue losses from churn reached $136 billion, citing 2024 Subscription Economy Index data (subscription churn statistics). That figure changes how SaaS operators should think about revenue optimization. The largest opportunity may not be another acquisition channel or a broad price increase. It may be the revenue already inside your product, billing system, and customer lifecycle.
For a small SaaS team, revenue optimization is a measurement discipline before it's a tactics library. You need to know which product events precede conversion, expansion, failed payment, downgrade, and cancellation before you automate messages or alter prices. Once that measurement layer is trustworthy, lifecycle programs, pricing experiments, and recovery flows become practical weekly operating tools rather than disconnected growth projects.
Table of Contents
- What Revenue Optimization Means for SaaS
- Treat revenue as a living system
- From Airline Yield Management to Subscription Billing
- The Revenue Optimization Framework
- Identify revenue leaks
- Prioritize opportunities
- Run a controlled experiment
- Measure impact and repeat
- High-Impact Tactics That Move the Number
- Lifecycle emails
- Pricing and packaging
- Expansion plays
- Dunning and churn-save flows
- KPIs, Instrumentation, and Guardrails
- Build the event-to-metric chain
- Short Case Examples and Realistic Uplift Ranges
- Implementation Checklist and Next Steps
- Week one
- Week two
- Week three
- Week four
What Revenue Optimization Means for SaaS
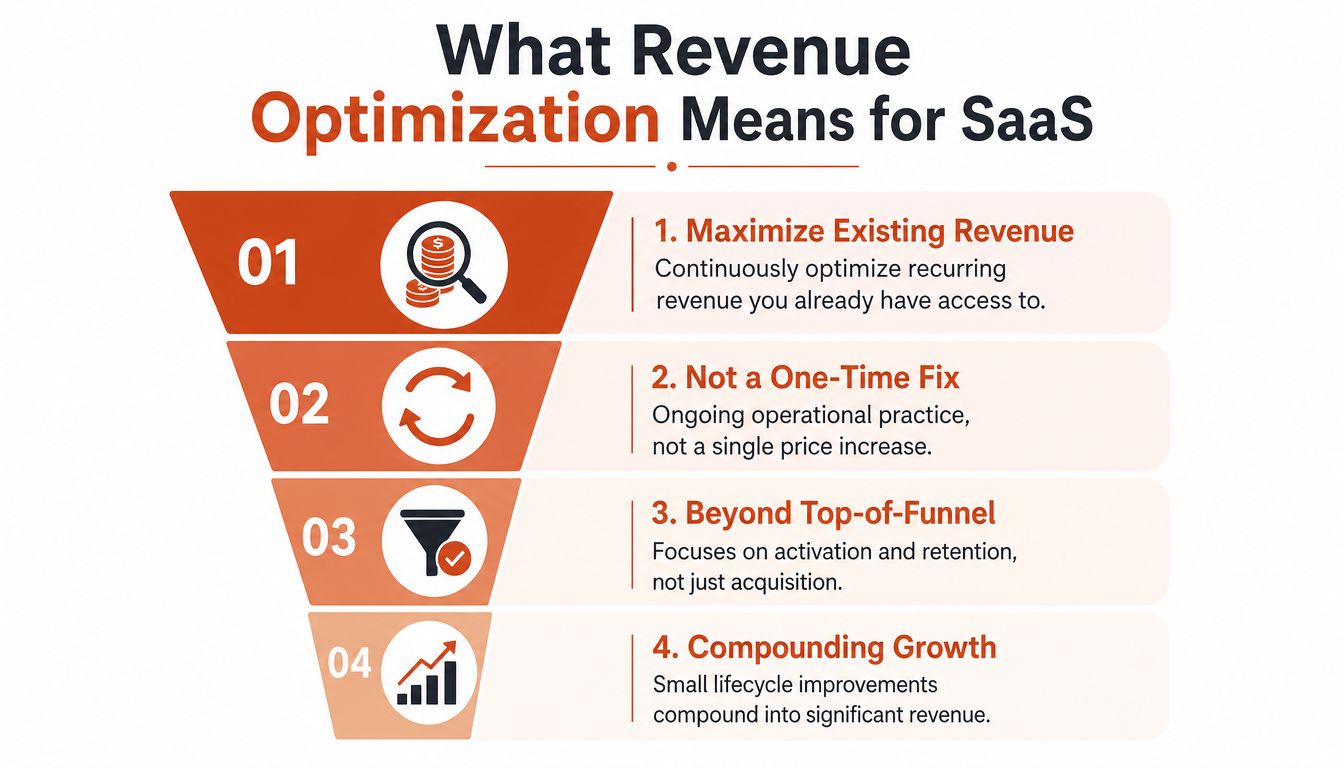
Revenue optimization is the continuous practice of maximizing the recurring revenue a SaaS business can earn from its existing demand, customers, pricing model, and billing relationships. It isn't the same as raising prices once, and it isn't just adding more leads to the top of the funnel.
A useful operating model treats recurring revenue as a set of controllable movements:
- New business: Customers who start paying.
- Expansion: Existing customers who add seats, usage, or higher-value capabilities.
- Contraction: Customers who downgrade, reduce usage, or remove seats.
- Churn: Customers who stop paying, whether by choice or because a payment failed.
Your income statement records the result after those events happen. Revenue optimization gives the team a way to act before the result is final. A renewal approaching, a sudden usage spike, an unused seat, a stalled trial, and a failed card are all signals that can trigger an operational response.
Treat revenue as a living system
A SaaS subscription changes over time. Product usage influences perceived value, perceived value influences renewal intent, billing health determines whether a willing customer remains active, and packaging determines how much value the customer can buy. Those relationships make revenue a forward-looking operational variable, not just a static accounting outcome.
Start by defining the events that matter. At minimum, connect product, subscription, and payment data around a stable customer or account identifier. You should be able to answer whether a customer activated, reached a meaningful feature, invited teammates, hit a plan limit, failed payment, requested cancellation, or returned after churning.
The practical payoff is focus. A small team can review these movements weekly, choose one leak, and test one intervention. The work might involve an activation email, an in-app prompt, a billing retry, a packaging change, or a save offer. The decision should follow the event, not the other way around.
For lifecycle design that connects customer stages to messaging and behavior, the customer lifecycle marketing guide provides a useful conceptual foundation. The important distinction is operational: revenue optimization asks what happened, why it happened, and which intervention can change the next event.
Practical rule: Don't automate a revenue decision until you can name the event that triggers it and the metric that proves it worked.
From Airline Yield Management to Subscription Billing
Revenue optimization became a formal discipline through revenue management, which is commonly described as the science of maximizing revenue by controlling price and timing in environments with changing demand. A foundational milestone came with U.S. airline deregulation in 1978, which forced carriers to manage fare classes, capacity, and demand more scientifically (the foundational revenue management paper).
Airlines had an obvious constraint. An empty seat on a departed flight could never be sold later. That perishable inventory created a reason to forecast demand, segment buyers, control availability, and adjust prices as departure approached.
SaaS doesn't sell seats that expire at takeoff. It sells access that can renew, expand, contract, or fail to collect. The transferable discipline is still valuable, but the controllable signals are different. A SaaS team watches usage curves, plan limits, payment status, renewal timing, and customer intent rather than remaining capacity on a specific flight.
| Concept | Airline Yield Management | SaaS Revenue Optimization |
|---|---|---|
| Inventory | A seat expires when the flight departs | Subscription access renews over time |
| Demand signal | Search activity, booking timing, route demand | Activation, usage, plan limits, and billing behavior |
| Price decision | Fare class and availability by demand context | Tier, seat, usage, add-on, or renewal pricing |
| Revenue risk | Selling too cheaply or leaving capacity unused | Churn, contraction, failed payment, or poor packaging |
| Recovery lever | Reprice remaining inventory | Retry payment, save cancellation, reactivate, or expand |
| Control model | Forecasts, fare ladders, and booking rules | Event taxonomy, experiments, segments, and guardrails |
That contrast explains why dunning and expansion triggers deserve the same rigor as pricing tests. A customer with a failed card still values the product, but the billing system may classify the account as lost unless the team intervenes. A customer whose API volume rises may be ready for a higher-value plan, but a generic sales email can feel premature if it ignores the usage context.
A four-person SaaS team doesn't need an airline-scale revenue management system. It needs a lean version of the discipline: reliable events, clear segments, controlled price changes, and a weekly review of revenue movement by customer cohort. The system can start with a warehouse table, a billing webhook, a lifecycle tool, and an experiment log.
The Revenue Optimization Framework
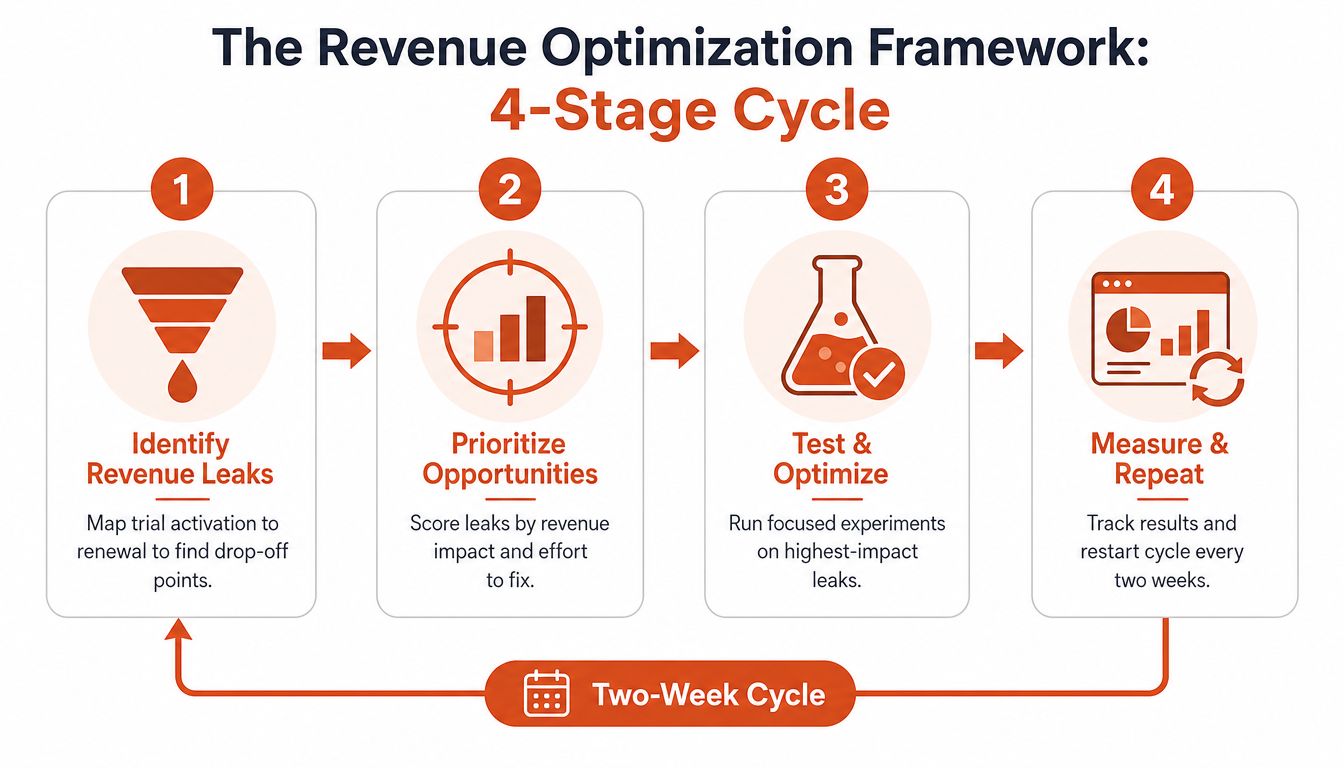
A practical framework should survive a real product roadmap. Run the following cycle in two-week intervals, keeping the artifacts lightweight enough that one product marketer, engineer, operator, or founder can maintain them.
Identify revenue leaks
Begin with a funnel audit that maps the customer journey from trial entry to renewal. Don't limit the audit to conversion rates. List the events that indicate a customer is losing momentum or value:
- Onboarding stall: The user signs up but never reaches the first meaningful action.
- Activation gap: The user explores the product but doesn't complete the behavior associated with early value.
- Trial drop-off: The account reaches some product activity but doesn't become paid.
- Unused capacity: Seats remain unassigned or usage stays well below the plan's intended value.
- Payment failure: A card fails, a retry fails again, or the customer doesn't update billing details.
- Silent cancellation: Usage declines, renewal approaches, and no save or feedback path is triggered.
For every leak, record the event definition, affected audience, current intervention, owner, and downstream revenue movement. If the team can't agree on what “activated” means, stop there. A dashboard built on inconsistent definitions will only create false confidence.
Prioritize opportunities
Put each leak into an ICE scoring sheet. Rate impact, confidence, and ease using a simple internal scale, then rank the opportunities into one backlog. The score isn't a scientific truth. It's a forcing function that stops the loudest stakeholder from selecting the next project by intuition alone.
A failed payment flow may outrank a new onboarding series if billing data shows a large recoverable audience and engineering only needs to expose an event. A pricing page redesign may wait if the team can't separate self-serve buyers from sales-assisted accounts.
Run a controlled experiment
Create an experiment design document before building the treatment. It should state the hypothesis, target audience, trigger, control experience, treatment experience, primary metric, guardrail metric, sample size, and minimum detectable effect. If you can't define what improvement would justify shipping, the idea isn't ready.
Use the same discipline for a lifecycle email, a pricing page variant, and a dunning sequence. Billing-related changes deserve a holdout wherever possible because a short-term collection lift can hide later cancellation or support damage.
The data-driven marketing solution is relevant here because the operating requirement is not merely more reporting. It's the connection between trustworthy event data, a testable intervention, and a decision the team can repeat.
Measure impact and repeat
The guardrail dashboard should answer one question: ship, hold, or roll back? Display treatment and control side by side, include the primary metric and paired guardrail, and annotate data-quality issues or product changes that could distort the result.
Use a decision log to record the outcome and reasoning. A negative result is useful if it narrows the next test. A positive result is incomplete until you know whether the effect persists, whether it shifts revenue from another segment, and whether customer experience worsens.
The framework stays deliberately small: funnel audit, ICE sheet, experiment document, and guardrail dashboard. Those four artifacts give a small team enough structure to make better revenue decisions without creating a separate bureaucracy.
High-Impact Tactics That Move the Number
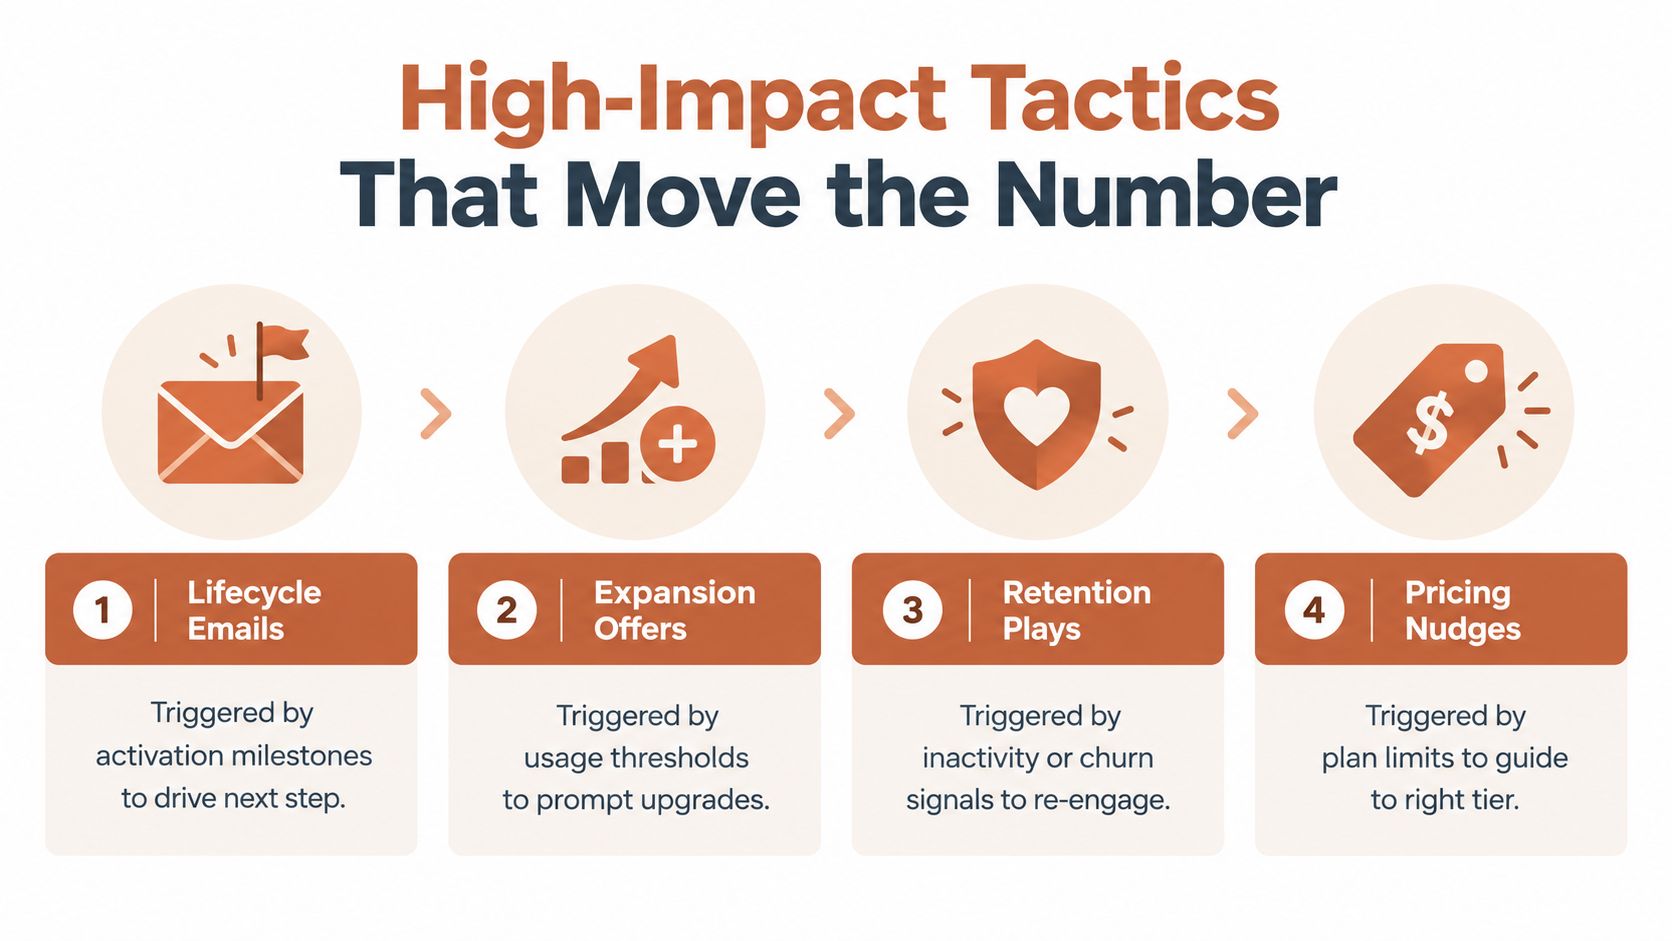
Revenue tactics work best when they're wired to a specific event. A broad campaign asks every customer to behave differently. An event-driven program responds to what a customer has already done, which makes the message, offer, and success metric easier to define.
Lifecycle emails
Trigger the first message from a meaningful product milestone, not just account creation. If a new user hasn't completed the setup action associated with first value, send a focused nudge that explains the next step and removes one source of friction. If the user has activated but hasn't invited teammates, branch the message around collaboration rather than repeating the welcome email.
Trial-to-paid programs should separate users who never reached value from users who reached value and hesitated. The first audience needs guidance or product education. The second may need proof, an explanation of plan limits, or a clear path to continue.
Re-engagement also needs a behavioral trigger. A formerly active account that stops using a core feature should receive a message tied to that feature, while a low-intent subscriber shouldn't receive the same urgency. Measure paid conversion, activation completion, return usage, or revenue per recipient, depending on the event and business model.
Behavioral programs often outperform generic batch sends because the intervention arrives near a decision point. A 2026 benchmark summary reported abandoned-cart flows at USD 3.65 revenue per recipient on average, with the top 10% reaching USD 28.89 (the abandoned-cart benchmark summary). The lesson isn't to copy those figures into a SaaS forecast. It's to prioritize events that show clear intent.
Pricing and packaging
Pricing tests should change one commercial assumption at a time. You might introduce a new tier, offer annual prepayment, add a usage-based component, or adjust the boundary between plans. Gate an offer to the customers whose behavior supports it, such as power users approaching a feature or usage limit.
Avoid treating a uniform price uplift as the default. An evaluated subscription system reported a 16.2% revenue lift, 14.3% margin improvement, 2.3% churn versus 2.8% for static tiered pricing, and an 11.4% increase in customer lifetime value when dynamic adjustments used churn-aware guardrails (the evaluated elasticity pricing system). The same evaluation reported that a simple 8.3% revenue gain came with 3.9% churn and a negative 4.2% CLV impact, showing why topline revenue alone can mislead.
Teams that need a structured way to connect customer outcomes to willingness to pay can use these value based pricing frameworks as a reference. The framework should still be adapted to your own usage data, support burden, and retention behavior.
Expansion plays
Expansion starts with a qualified signal. Seat utilization, API volume, repeated use of a premium feature, or a feature-qualified lead can indicate that the customer has outgrown the current plan. The audience branch should distinguish a self-serve upgrade prompt from an account that needs a conversation with sales or customer success.
The offer envelope matters. Show the next relevant capability, explain the operational value, and make the upgrade path clear. Don't push an enterprise conversation to every account that has one active user, and don't wait for a customer to hit a hard limit if the product can identify the pattern earlier.
Track expansion revenue, upgrade conversion, retained usage, and support contacts. A pricing change can alter the expansion math, so these plays should be reviewed together rather than managed as separate campaigns.
Dunning and churn-save flows
Treat the first failed payment as a recovery event, not a cancellation event. Send a concise reminder, retry according to the billing system's logic, and branch based on whether the payment succeeds. If the second retry fails, increase urgency and offer a direct billing update path.
The recovery opportunity is substantial. A 2025 retention report states that 70% of failed payments were recoverable with better retries and reminders (the state of retention report). Keep payment recovery separate from voluntary churn. A customer who cancels because the product no longer fits needs a different message from a customer whose card expired.
Cancellation intent should trigger a save flow that asks for the reason before presenting an offer. Use a product pause, downgrade, or temporary adjustment when the reason supports it. Discounts shouldn't be the automatic response because they can preserve unprofitable or dissatisfied accounts without resolving the underlying problem.
KPIs, Instrumentation, and Guardrails
A revenue optimization program becomes operational when every tactic has a defined event, table, metric, and owner. Emit product events such as signup, activation milestone, feature adoption, seat invitation, usage threshold, cancellation intent, and reactivation. Land subscription events such as trial start, conversion, upgrade, downgrade, renewal, failed payment, recovered payment, and cancellation in a warehouse model keyed to the account.
Use a small metric hierarchy. Net revenue retention, gross retention, ARPA, and expansion as a share of starting ARR describe the commercial outcome. Activation rate, time to first value, free-to-paid conversion, failed-payment recovery, voluntary churn, and pricing-page bounce explain what is driving it.
For teams that need a concise explanation of the retention metric, this net revenue retention NRR definition is a useful reference. The calculation matters less than consistent inclusion rules. Decide how you treat credits, reactivations, expansions, and contractions before comparing cohorts.
Build the event-to-metric chain
A warehouse table should connect the customer, event timestamp, plan, treatment or control assignment, billing state, and resulting revenue movement. Add source campaign, message variant, cancellation reason, and UTM data where applicable. This lets the team distinguish a real recovery from a payment that would have succeeded without the email.
Pricing and packaging tests need explicit guardrails. Watch signups, support tickets, NPS, refund volume, and any customer behavior that could reveal hidden harm. A test that raises ARPA while increasing support demand or refunds may not be a successful optimization.
| Tactic | Primary KPI | Guardrail Metric | Rollback Threshold |
|---|---|---|---|
| Activation email | Paid conversion or activation completion | Unsubscribe rate and support contacts | Predefined adverse movement versus control |
| Pricing variant | ARPA or contribution revenue | Signups, refunds, support tickets, NPS | Any agreed material deterioration |
| Expansion prompt | Upgrade revenue | Downgrades and cancellation intent | Expansion fails to offset contraction |
| Dunning sequence | Recovered payment rate | Complaints and involuntary churn | Recovery does not justify customer friction |
| Churn-save flow | Retained revenue | Second cancellation or discount usage | Save creates short-lived retention |
Set rollback thresholds before launch, not after a concerning chart appears. A dashboard should display the threshold, current result, confidence status, and decision owner so the team can act without reopening the entire analysis.
The customer success metrics guide can help teams organize customer health indicators alongside financial outcomes. Keep the model practical. If an event can't be trusted, don't use it to trigger an automated revenue decision.
Short Case Examples and Realistic Uplift Ranges
Consider a representative pricing-page test for a mid-market SaaS tier. The treatment changes the package boundary and clarifies the value of an included capability, while the control keeps the existing page. The winning arm might produce a 3% to 8% ARPA uplift, but that range is only useful if the team also watches sales cycle length, self-serve conversion, refunds, and later retention.
The test should use a holdout and a preregistered hypothesis. A higher contract value can come from fewer, larger deals rather than healthier demand. If self-serve conversion falls or sales cycles lengthen enough to increase acquisition cost, the apparent ARPA win may not improve durable ARR.
A second representative example starts with trial users who reached an activation milestone but never became paid. A four-email win-back sequence can branch by product behavior, use a conditional offer only for the appropriate segment, and stop sending when the account converts or becomes inactive.
Teams commonly describe a 6 to 12 point lift in trial-to-paid conversion for this type of correctly triggered sequence, but that range shouldn't be treated as a forecast without a cited source in your own measurement plan. The defensible approach is to use a control group, define the conversion window before launch, and measure paid retention after the initial conversion.
For churned subscribers, industry guidance commonly places a good SaaS win-back reactivation benchmark around 5% to 15%, with second-churn rate tracked to ensure recovered customers remain active (win-back benchmarks for SaaS). Sequences are often structured as 3 to 5 emails over several days, and one source notes that most reactivations happen within 60 to 90 days (win-back email sequence guidance). Those benchmarks are directional. Your decision should rest on recovered revenue, offer cost, and durable retention.
Implementation Checklist and Next Steps
A small team can start revenue optimization in 30 days without building a new department.
Week one
Run the funnel audit from trial activation through renewal. Produce a leak inventory with event names, affected segments, current owner, and known revenue consequence. Fix inconsistent definitions before choosing a tactic.
Week two
Score the inventory with ICE and select three opportunities for testing. Produce the experiment documents, including treatment, control, primary metric, guardrail, and decision rule. Keep the first cycle narrow enough to finish.
Week three
Ship one lifecycle email, one pricing or packaging variant, and one dunning flow, but only where the required events already fire reliably. If your team also needs to review infrastructure spending that affects contribution margin, SpendLens AI's cost optimization guide offers a separate starting point for that work.
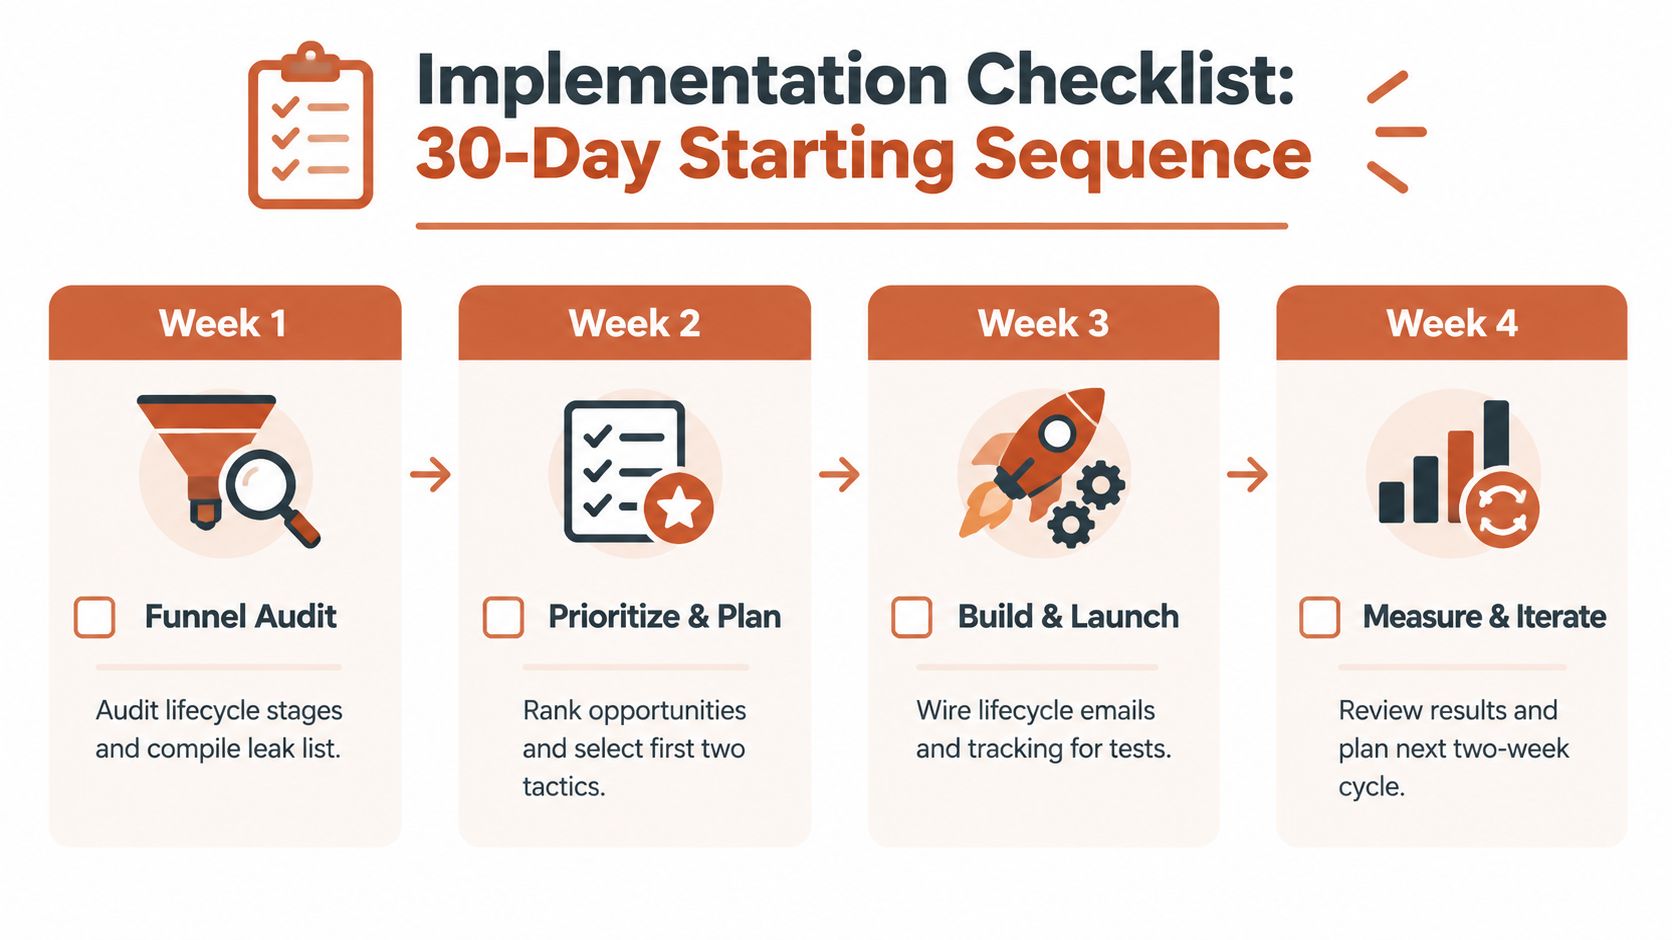
Week four
Review the guardrail dashboard, keep or kill each experiment, and document the decision. Your first-cycle artifacts should include a clean event taxonomy, a tested treatment and control pair, an ICE backlog, and a decision log owned by named roles across product, marketing, finance, or engineering.
For the first 90 days, put net revenue retention on the wall. Let the supporting metrics explain movement, but keep the team focused on whether the installed customer base is retaining and expanding its recurring value.
Mara helps SaaS teams turn product and billing events into approval-controlled lifecycle journeys for activation, expansion, dunning, churn-save, and win-back programs. If your team needs to connect measurement with emails that can be drafted, tested, and operated from those events, visit Mara and map your first recovery or retention journey.